Data Source & Purpose of Data Analysis
Data Source : Youtube(Channel : Yoga with Adriene)
Purpose of Data Analysis : Let's pull the data from a youtube channel and analyze the data
If you want to see this project from github, please click this Link
1. Prepare the environment for Web scraping
1.1 Import Libraries
# import libraries
from googleapiclient.discovery import build
import pandas as pd
import seaborn as sns
1.2 Prepare API key and channel ID
# prepare api key and channel id
api_key = 'AIzaSyC7pCgKz77npiTz7cVQlD7V0-S_5Ih8ybM'
channel_id = 'UCFKE7WVJfvaHW5q283SxchA'  # Youtube Channel 'Yoga with Adriene'

youtube = build('youtube','v3',developerKey=api_key)
2. Function to get channel statistics
def get_channel_stats(youtube, channel_id):

request = youtube.channels().list(
    part = 'snippet,contentDetails,statistics',
    id = channel_id
)

response = request.execute()

data = dict(title = response['items'][0]['snippet']['title'],
            country = response['items'][0]['snippet']['country'],
            subscribers = response['items'][0]['statistics']['subscriberCount'],
            views = response['items'][0]['statistics']['viewCount'],
            videos = response['items'][0]['statistics']['videoCount'],
            playlist = response['items'][0]['contentDetails']['relatedPlaylists']['uploads']
)

return data
channel_data = get_channel_stats(youtube, channel_id)3. Function to get video ids
def get_video_ids(youtube, playlist_id):

request = youtube.playlistItems().list(
    part = 'contentDetails',
    playlistId = playlist_id,
    maxResults = 50
)

response = request.execute()

video_ids = []

for i in range(len(response['items'])):
    video_ids.append(response['items'][i]['contentDetails']['videoId'])

next_page_token = response.get('nextPageToken')
more_pages = True

while more_pages:
    if next_page_token is None:
        more_pages = False
    else:
        request = youtube.playlistItems().list(
                    part = 'contentDetails',
                    playlistId = playlist_id,
                    maxResults = 50,
                    pageToken = next_page_token
                )

        response = request.execute()

        for i in range(len(response['items'])):
            video_ids.append(response['items'][i]['contentDetails']['videoId'])

        next_page_token = response.get('nextPageToken')

return video_ids
video_ids = get_video_ids(youtube, channel_data['playlist'])4. Function to get video details
def get_video_details(youtube, video_ids):

all_video_stats = []
for i in range(0, len(video_ids), 50):
    request = youtube.videos().list(
                part = 'snippet,statistics',
                id = ','.join(video_ids[i:i+50])
    )
    response = request.execute()

    for video in response['items']:
        video_stats = dict(Title = video['snippet']['title'],
                            Published_date = video['snippet']['publishedAt'],
                            Views = video['statistics']['viewCount'],
                            Likes = video['statistics']['likeCount'],
                            Comments = video['statistics']['commentCount'],
                            )

        all_video_stats.append(video_stats)

return all_video_stats
5. Create a dataframe with video details
video_details = get_video_details(youtube, video_ids)
video_data = pd.DataFrame(video_details)
video_data.head()
6. Clean data
video_data['Published_date'] = pd.to_datetime(video_data['Published_date']).dt.date
video_data['Views'] = pd.to_numeric(video_data['Views'])
video_data['Likes'] = pd.to_numeric(video_data['Likes'])
video_data['Comments'] = pd.to_numeric(video_data['Comments'])
video_data.head()
7. Process and Analyze the data
7.1 Top 10 Videos
top10_videos = video_data.sort_values(by='Views', ascending=False).head(10)
top10_videos
ax1 = sns.barplot(x='Views', y='Title', data = top10_videos)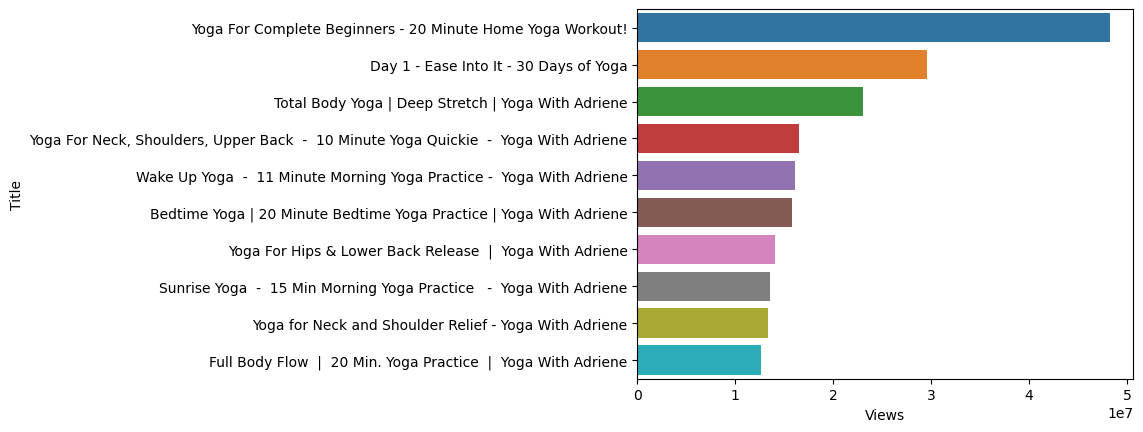
7.2 Sort the data by month
video_data['Month'] = pd.to_datetime(video_data['Published_date']).dt.strftime('%b')
videos_per_month = video_data.groupby('Month', as_index=False).size()
sort_order = ['Jan', 'Feb', 'Mar', 'Apr', 'May', 'Jun', 'Jul', 'Aug', 'Sep', 'Oct', 'Nov', 'Dec']
videos_per_month.index = pd.CategoricalIndex(videos_per_month['Month'], categories=sort_order, ordered=True)
videos_per_month = videos_per_month.sort_index()
# New video release count per month
ax2 = sns.barplot(x='Month', y='size', data = videos_per_month)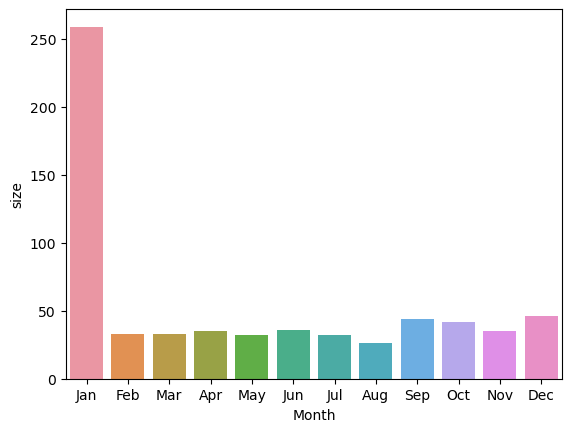
7.3 Total views for each year
video_data['Year'] = pd.to_datetime(video_data['Published_date']).dt.strftime('%Y')
views_per_year = video_data.groupby('Year', as_index=False).Views.sum()
views_per_year
# Total views per year
ax3 = sns.barplot(x='Year', y='Views', data = views_per_year)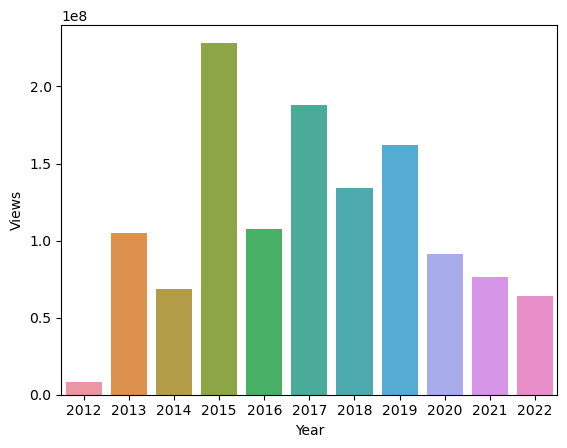
7.4 Total Video released each year
videos_per_year = video_data.groupby('Year', as_index=False).Title.count()
videos_per_year
# Published videos per year
ax4 = sns.barplot(x='Year', y='Title', data = videos_per_year)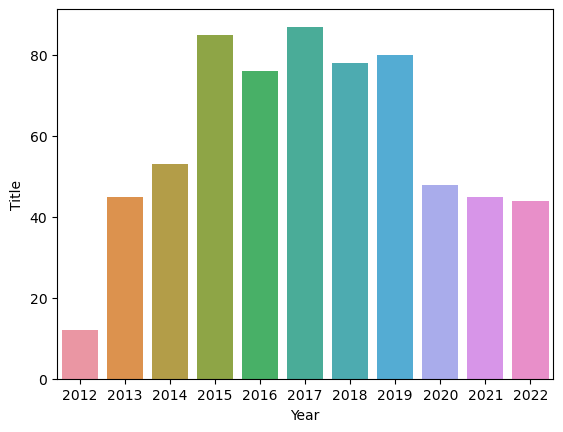
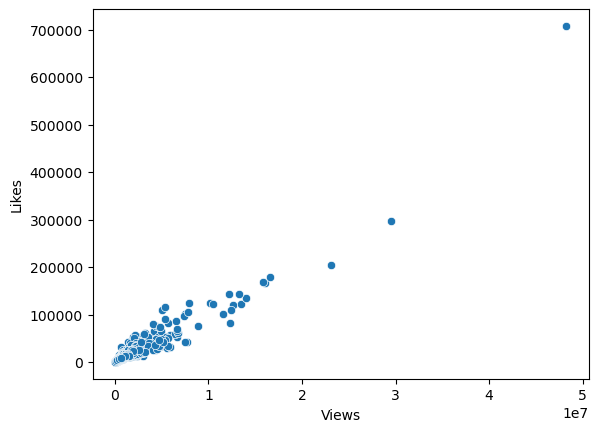
7.5 Correlation between View counts and Likes
# correlation between the view count and the like count
ax5 = sns.scatterplot(x='Views', y='Likes', data=video_data)